London buses are the slowest they’ve been in at least ten years, with recent average speeds of just 9 mph, according to analysis of TfL data.
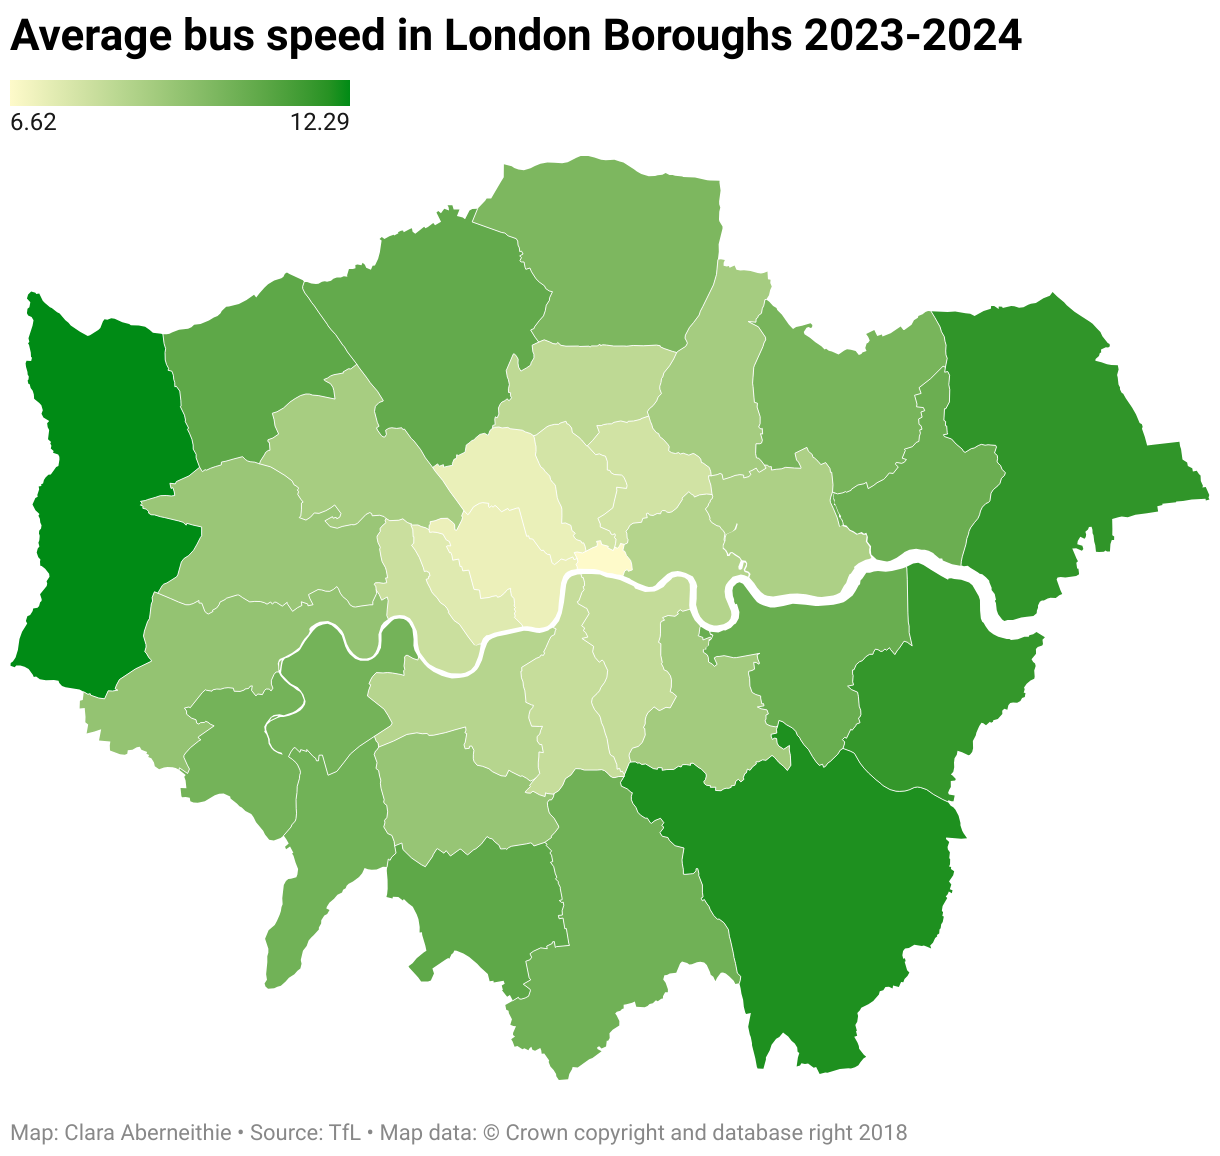
TfL bus speeds between April 2023 and March 2024 ranged between 7mph in the City of London and 12mph in Hillingdon.
Of the buses which ran in both 2013/14 and 2023/24, 90% have decreased in speed.
Unsurprisingly, buses travel much faster in outer London compared with inner London, with Hillingdon, Bromley and Havering the fastest three boroughs and City of London, Camden and Westminster the slowest.
See where your area ranks in bus speeds with the interactive map below.
The data shows the average speeds in boroughs on a 24/7 basis, meaning that it includes the speeds of buses travelling at both rush hour and late at night.
We therefore expect that the average experience traveling on TfL buses will be slower than our analysis suggests, given that most people travel during the day.
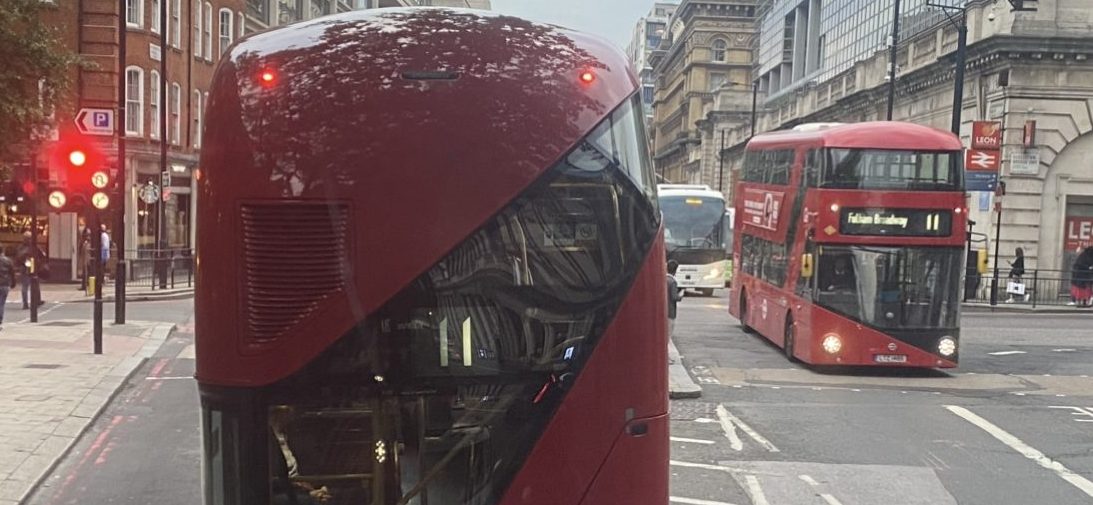
Out of the bus routes which ran consistently over the ten years, the slowest bus route was the number 11 at 6mph while the fastest was number 246 at 18 mph.
The number 11 travels from Fulham Town Hall to Waterloo Station, passing through Chelsea and Victoria.
Nimai Vadgama, who travels on the number 11 five times per week and has done so for the past five years, said: “They really need to put a bus lane on King’s Road because there’s just so much traffic, I mean, it’s currently a recipe for disaster.
“When you’re travelling from central London back to Fulham, you’re better off taking the tube or getting off at Sloane Square and walking, which is quite a distance.”
Janka Jaščurová, who now avoids the number 11 when possible, said: “It happened to me a few times that in World’s End it would just end its destination or just get stuck there!
“I definitely avoid the 11 as I really don’t like how hot and unventilated it is as well as slow.”
Henry Graham, who regularly travels between Hammersmith and central London, said: “The number 11 is an incredibly slow route, I only really take it when I have to.
“It takes twice the time to get half way through my journey than it does to do the whole route by Tube.”
The Covid-19 lockdown appears to have had a significant effect in increasing bus speeds from 2020-2021 as buses were 10% quicker than the previous year. But since then, speeds have fallen.
See your bus’s speed over the past ten years using the search bar below.
Philip Gerhardt, TfL’s Head of Bus Performance, said: “London’s bus network remains the most popular form of public transport in London, with millions of journeys every day.
“Our buses allow people to get around the city affordably, while making a real difference to public health and air quality.
“We are continuously working to improve journeys for customers, through the introduction of new bus lanes and signal re-timing, and we remain focused on delivering our Bus Action Plan which commits us to a 10 per cent improvement on speeds recorded in 2015.
“The introduction of 25km of new bus lanes by 2025 will be central to achieving this target.”
With the exception of the pandemic (2019/20-2020/21), the average speeds of TfL buses over the past ten years have repeatedly decreased year on year.
The pandemic period saw an average increase of 0.97 mph. With a commitment to improve speeds by 10% since 2015/16, TfL will need to now increase bus journeys by 1.23 mph.
While these figures may seem small, their impact is significant, particularly for buses travelling long distances through congested areas.
According to the TfL website, a 1% improvement in journey times leads to a 0.6% increase in demand.
In most cases, buses are the cheapest form of public transport, costing £1.75 for a fare and TfL bus journeys are also free for children and over 60s.
Women, younger people, those on lower incomes, and people of colour are more likely to rely on buses according to research by London TravelWatch.
Methodology
Raw data was sourced from TfL’s bus performance data.
This provided average bus speeds for each bus route and London borough by month, over the past ten years.
Please note that TfL has changed many bus routes and numbers over the past ten years. While we have tried to reflect this change in the dataset, not all changes could be noted.
Speeds may not always reflect travel times.
Please note that some boroughs have been covered in multiple areas. For instance, Southwark is categorised as both South London and Central London.