South London has one of the highest levels of air pollution in the capital according to statistics published by City Hall in conjunction with London Datastore’s Air Quality team.
Made up of the boroughs of Bromley, Croydon, Kingston Upon Thames, Merton, Sutton and Wandsworth, South London exceeded the legal NO2 limit set out by the World Health Organization (WHO) by 13% in 2021 and 8% in 2022.
However, all of the 31 boroughs where NO2 levels were measured breached the WHO limit – Bexley and Harrow have not installed air quality monitors despite government recommendations.
Diffusion tubes – located in almost all boroughs – which measure the concentration of nitrogen dioxide (NO2) in the air reveal South London is the worst offender for exceeding legal limits.
The graph above shows a comparison of the percentage of toxic air exceeding the legal limit in London boroughs for 2021 and 2022.
The 5% reduction between 2021 and 2022 is the best percentage decline of all regions, with central London witnessing just a 2% reduction, but there is still work to be done.
Hirra Khan Adeogun, Head of Car Free Cities at climate charity Possible, said: “The WHO clean air targets reflect the best available health evidence.
“This data shows just how much work there is still left to do on driving down air pollution and emissions in London.”
The data also shows the difference between outer and inner London pollution figures is slight: the average roadside concentration in inner London was 27.8% versus 29.8% in outer London.
This suggests the need for clean air initiatives to extend across the breadth of London and not simply remain concentrated in the centre which statistics for South London boroughs exemplify.
In 2021, Merton exceeded the legal limits for NO2 by 27%, the highest of all the boroughs from which measurements were taken, closely followed by Brent at 26% and Croydon at 25%.
Though both Merton and Croydon witnessed a decline to 15% and 13% respectively, concern remains for the extent to which children in particular are being exposed to toxic air.
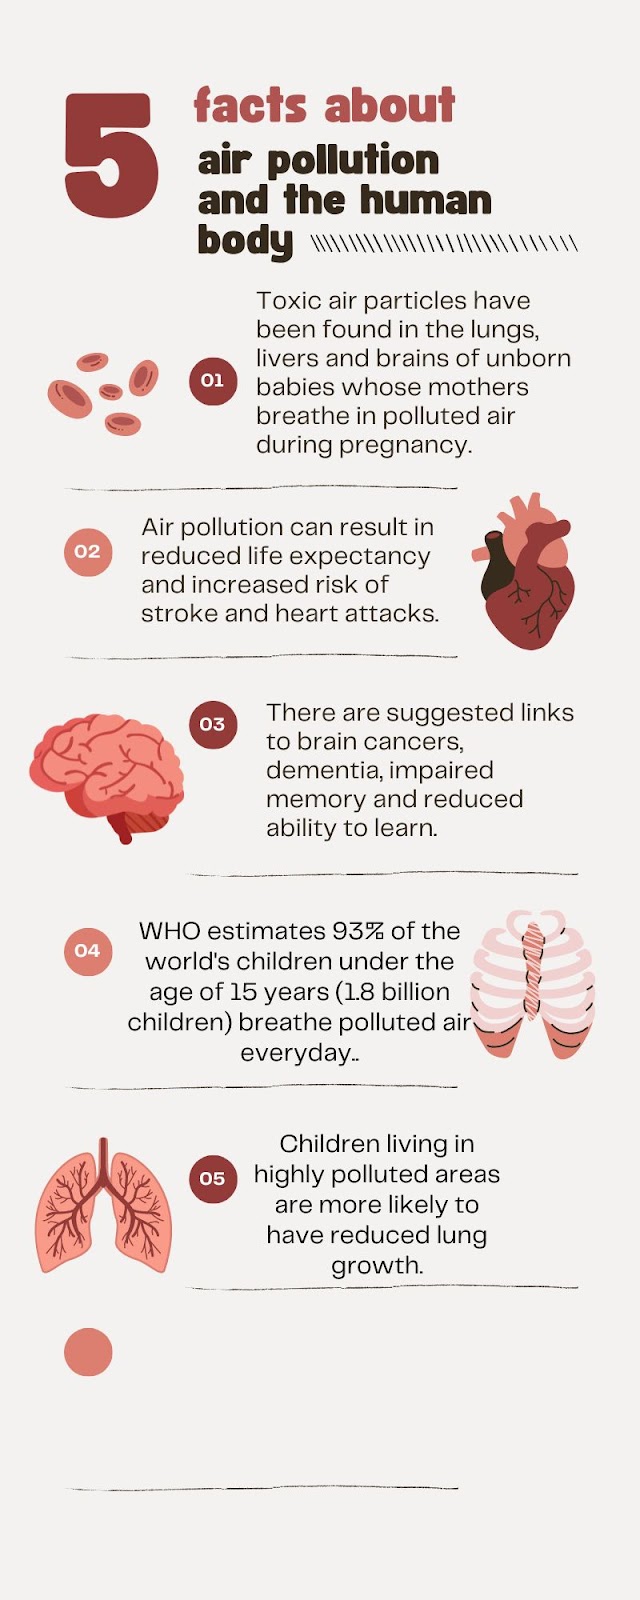
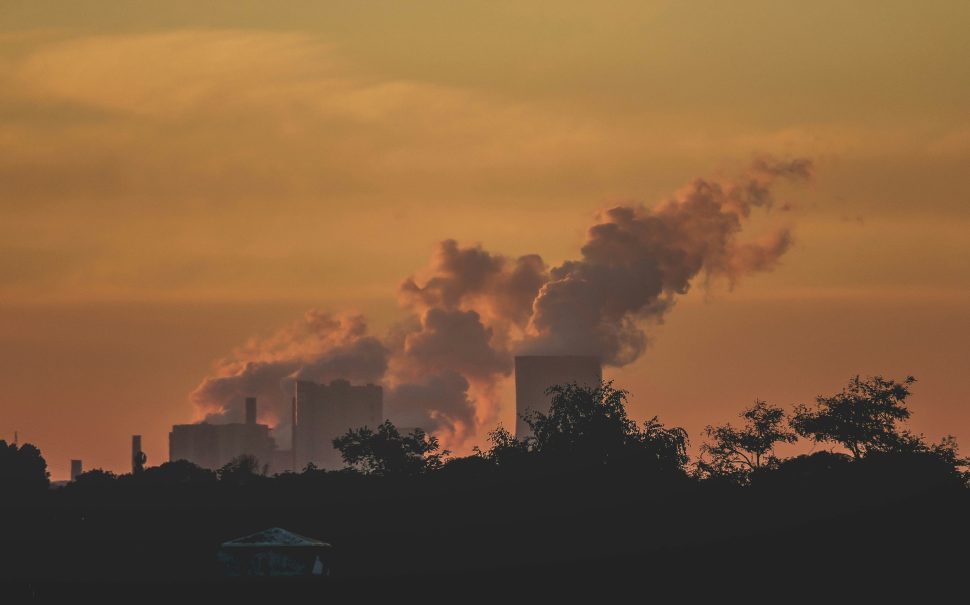
Both short and long-term exposure to toxic air can have health implications including respiratory infections and aggravated asthma – conditions for which London has a prevalent diagnoses rate.
According to research released by Asthma and Lung UK in 2023, the number of children ending up in hospital with life-threatening asthma more than doubled in 12 months from 2021-2022.
While there may be varied explanations for this, including a natural increase due to the relaxation of Covid restrictions and an increase in the number of GP appointments, research published by Imperial College London suggests air pollution remains a key factor.
The key findings evidenced the exacerbation of asthma by air pollution had led to approximately 700 asthma admissions from 2017 to 2019 in children in London.
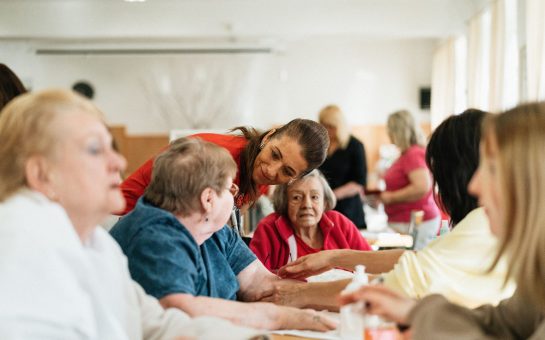
The founder of Mums For Lungs, a charity dedicated to raising awareness about the effects of air pollution on children across London, believes the City Hall statistics highlight a “public health crisis”.
Jemima Hartshorn was living in Brixton while on maternity leave in 2017 – where air pollution levels would often exceed the annual legal limit by 6 January – when she started the charity.
She said: “I want to see more action happening. We know the air pollution we are breathing is keeping people at home, unwell, sick.
“I want to see change, but I worry that people and policy leaders are commiting to certain things without being absolutely sure they are on track when delivering new schemes.”
While Mums For Lungs has been at the forefront of campaigns, including one calling for controlled parking zones close to schools to promote a “cleaner London for our children”, Hartshorn believes the inaccessibility of data is hindering progress.
She said: “This government has been the biggest obstacle to health in the UK imaginable. Whether we talk about air pollution or any other health.
“It’s very hard for local campaigners to even keep local authorities accountable because we don’t know if their schemes are having a desired impact.”
As a result, Mums For Lungs has called for a state-of-the-art website for Londoners which provides access to all air quality monitor readings as well as past, present and projected data.
While the LondonAir website includes live air quality readings for different London boroughs, the data is difficult to comprehend.
“We need to be able to transparently assess the data being published,” said Hartshorn.
“It’s hard to respond to people who claim air pollution ‘isn’t that bad’ if there isn’t a single comprehensive website that has the data to dispute that.”
Our World in Data, a website founded to publish data to make ‘the big problems’ accessible and understandable, is one site which colates air pollution data to enable global comparisons.
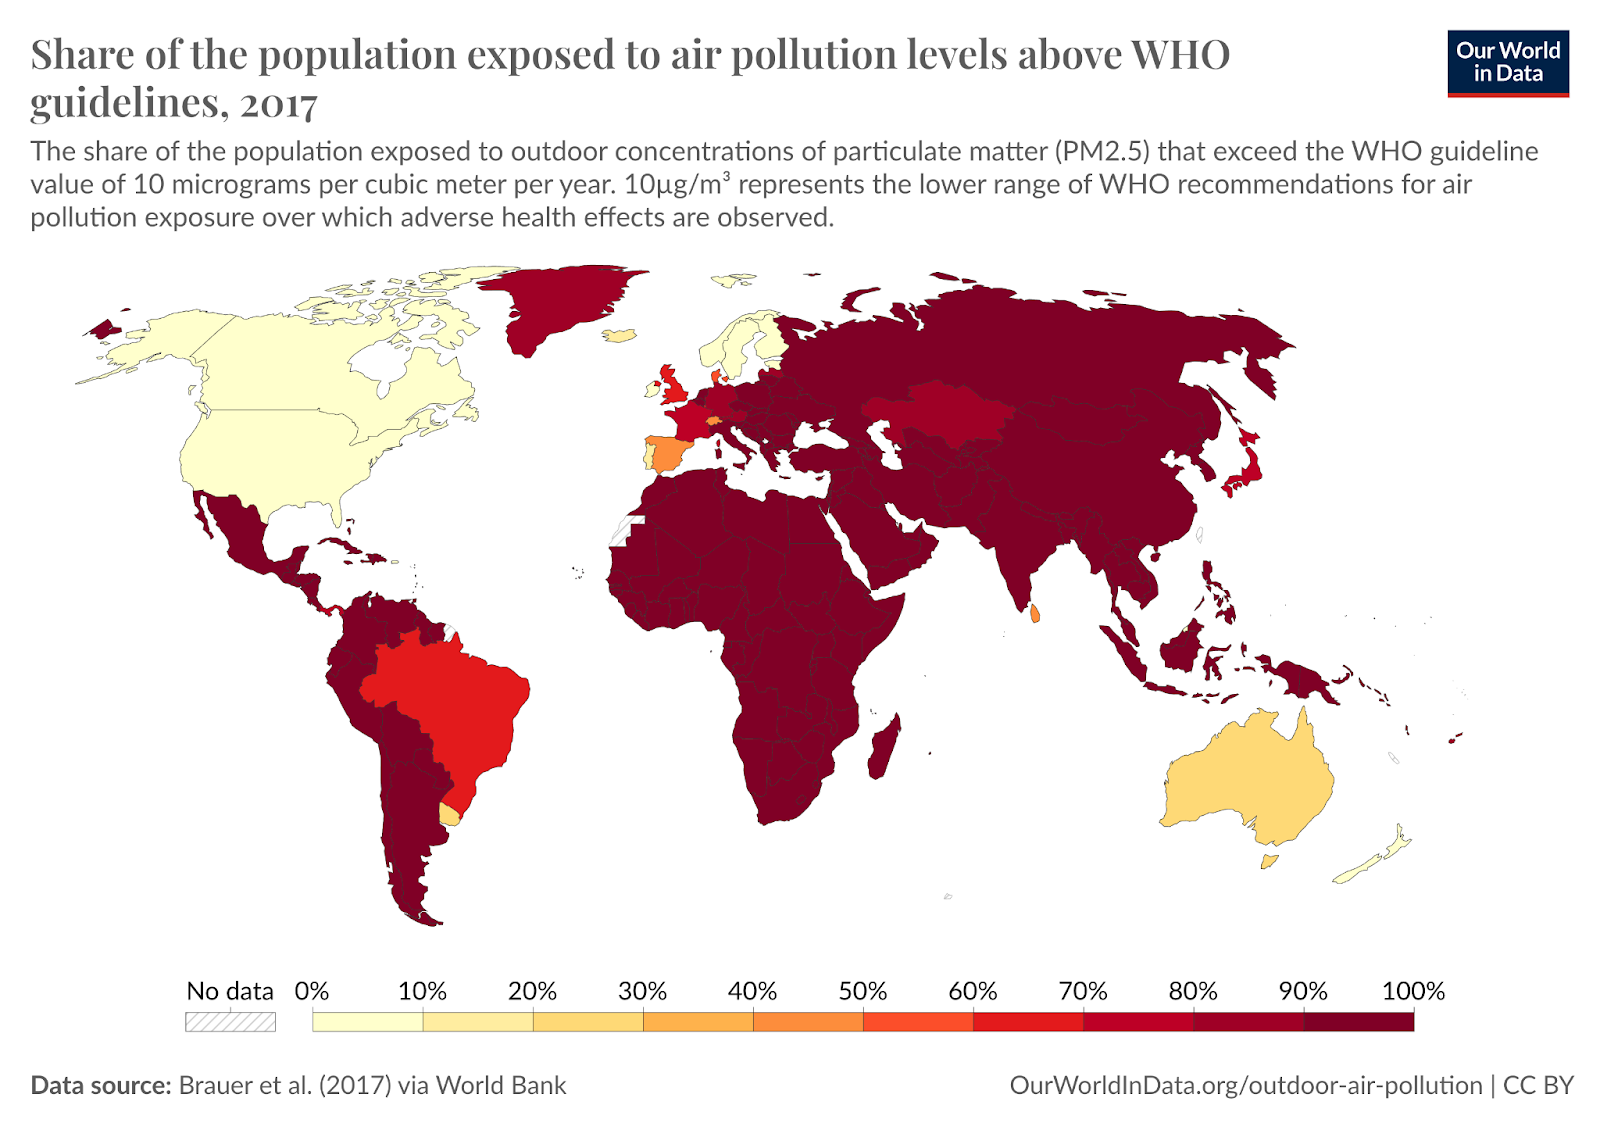
According to data collected via World Bank and visualised on the map above, two-thirds of the population in the UK were being exposed to air pollution levels above WHO guidelines in 2017.
While the figures published by City Hall for 2022 indicate air pollution levels in London are declining, the rate of change remains slow.
Hartshorn believes this is down to limited government initiative.
She added: “There are so many campaigners within the air pollution sphere – the knowledge is all there but it’s the lack of political leadership.
“We have some of the best researchers on air pollution in the world. We know what the problems are, what the sources are, we know what the solutions are. The issue we have is the lack of political will.”
While the results of the expansion of London’s Ultra-Low Emission Zone last year may show further progress, the major marker of success may be whether a single borough has managed to ‘clean up’ their streets to reach the WHO guideline.
The Department for Environment, Food and Rural Affairs was contacted for a right of reply but failed to respond.
*Please note NO2 concentration levels measured are reflective of the monitoring sites selected by each borough, therefore the comparisons made between regions in this article may be open to reevaluation.