By Victoria Brzezinski
July 14 2020, 15.00
Follow @SW_Londoner
Kensington and Chelsea has experienced the biggest drop in property prices in London, while Hackney has seen the greatest rise, according to estate agency Hamptons International.
The agency found a minimal change in the overall average price of a home in the capital — £475,030, down 0.1% on the previous year — but revealed stark differences in price trends across London.
Hamptons used Office for National Statistics (ONS) data to compare average house prices in each borough over the past 12 months versus the previous 12 months.
Average house prices in Kensington and Chelsea — the UK’s most expensive borough — have dipped by 5% to £1,258,860 while in Hackney prices jumped 4.9% to an average £569,030.
It found Hounslow was second only to Hackney in terms of price growth, with figures up by 4.7% over 12 months to £405,990, while Barking and Dagenham has seen a 2.35% increase to £302,870.
Worst affected boroughs include Brent, which saw average prices dip 4.7% to £467,030 and the City of London, where prices fell 4.6% to £771,330.
House prices across Greater London were falling for the whole of 2019 and half of 2018, according to the ONS.
“Up until the middle of last year, we were seeing much greater house price falls in central London while the outer areas were still seeing healthy levels of price growth,” said Aneisha Beveridge, Hamptons’ head of research.
“We always talk about a ripple effect flowing out of central London and by the end of 2019 and into the beginning of 2020, we started to see house price falls in outer London while prices started to rise in central boroughs such as Lambeth and Hackney.
“Everyone was talking about a Boris bounce; the market sprung back into life at the beginning of the year which is when we started to see prices rise again, particularly in those inner London suburbs which is reflected in this analysis too.”
The Covid-19 pandemic meant the English property market was frozen for almost seven weeks, from March 26 until May 13.
“It’s all changed again post-lockdown,” added Ms Beveridge.
“Although we don’t really know what’s happening to house prices in London at the moment, we do know the outer suburbs are becoming quite popular.”
Figures from property forecasting tool PropCast echo this sentiment.
PropCast takes the temperature of a postcode by calculating what proportion of properties on the market are under offer or sold subject to contract.
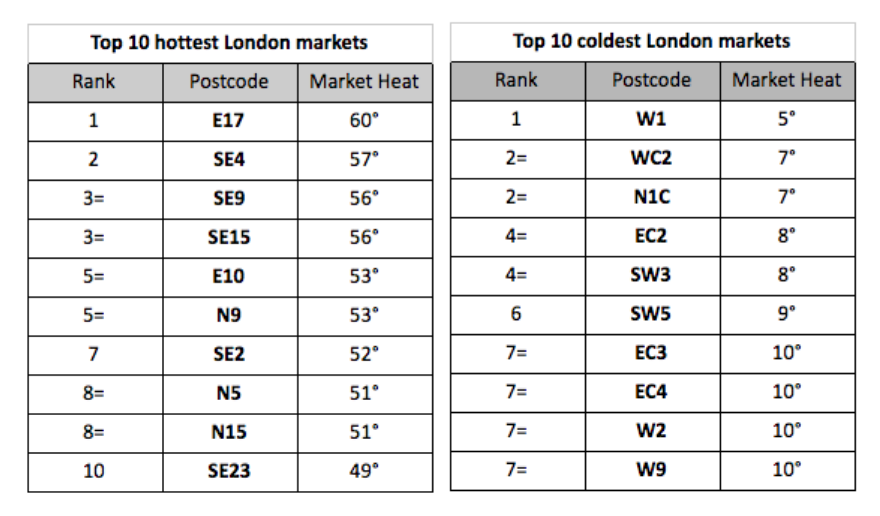
There are four brackets: very cold (under 25°), cold (25°-34°), hot (35°-49°) and blistering (over 50°).
PropCast reveals that nine of London’s current 10 coldest markets are in central or inner London, bar W9 (Maida Vale, which is covered by inner boroughs Camden, Westminster, Kensington and Chelsea and the outer borough Brent).
Only three of the top 10 hottest postcodes are in inner London: SE4 (Lewisham), N5 (Highbury) or SE23 (Forest Hill).
PropCast founder Gavin Brazg said: “Since lockdown, there’s pent-up demand from buyers, which remains strong and hasn’t petered out yet.
“The majority of that demand is from first-time buyers, who are much more likely to be interested in the lower end of the market, which is why we’re seeing more buyer demand and activity in E17, SE4 and SE9 compared to the rarified prime London buyer market in W1, N1C and so on, which is a completely different buyer profile.
“Investor buyers and HNWIs with their finger on the pulse of global macroeconomics are probably thinking, crumbs, we’re looking into the eye of major global downturn — now is not the time to be investing in property.”