Later this month the 23rd edition of the T20 Blast will rev its engine and screech off into the distance, culminating in September after 133 matches that look to break new ground in the pursuit of monstrous scores.
What started out in 2003 as a playful experiment has morphed into a cross-continental kaleidoscope of sixes and fancy dress.
Nearly £1billion of foreign investment has flown into the English game this year, all reaching for a piece of the short format pie.
On the eve of the first ever T20 match in 2003, England’s Adam Hollioake, said: “The run target, if you bat first, depends on the conditions. But, if you’re playing on a good pitch, with 70-yard boundaries, you should be looking at something like 160. This figure will go up the more games we play.”
Nearly two and a half thousand men’s T20 matches have passed in the UK since, and drilling into the run-rates, i.e. how many runs are scored by a team every six balls faced, the picture becomes a little clearer.
A Tale of Two Halves
With 22 seasons played all told, breaking down the data into two blocks of 11 best illustrates the progression of run rates since 2003.
Between 2003 and 2013, the average runs scored per 6 balls across all 18 teams was 7.8, with the 2011 season seeing the leanest year of runs scored per over at 7.5. This gives rise to an average total of just over 156 per team over the decade, low by today’s standards.
Compare this to the second half of the dataset, 2014 to 2024, and the average run rate per over ticks up to 8.46872843, equating to an average team total of nearer 170. In 2023 Somerset won the title with an average run-rate of 9.68, an astonishingly consistent display of hitting across a season.
Whilst the mean number of total games played from 2003 to 2013 was less (93) than from 2014-2024 (129), this uptick of over half a run per over, extrapolated across thousands of games, tells a significant story. The graph below charts the run rates of each team since the inception of t20 cricket in the UK in 2003. The search bar allows comparison between teams and overall averages across the counties.
Strength & Conditioning, Bats & Ground Sizes
In cricket, as with all sport, the commitment to professionalism has shaped the way the modern game is played. Improvements in strength and conditioning have meant that batsmen have not only gotten stronger, with miss-hit balls still able to carry the distance to the boundary, but are running quicker between the wickets to accumulate rapid singles and twos.
‘Power-hitting,’ an exercise where batsmen seek to strike the ball as far as they can throughout the duration of a training session, has become commonplace in most cricket sides over the past decade.
Rory Skinner, a member of Middlesex County Cricket Club, said: “Batters playing in the T20 Blast have repeatedly broken scoring records and broadened the horizons on what is actually possible to score in a limited overs match. Once upon a time a century was unthinkable, now they are commonplace.
“This, coupled with the usual observations of practising distance hitting, improved data diagnostics on bowlers, S&C improvements and the demand from governing bodies to have flatter, more batter friendly wickets.“
Notwithstanding the occasional outlier, the last 20 years have also seen the blurring of lines when it comes to players who purely bat, and players who purely bowl. For bowlers to increase their chances of selection and attract lucrative offers from t20 leagues around the world, batting line ups have lengthened significantly since 2003, often with capable six-hitters coming as far down the order as no. 9.
Adjustments in bat making have also had their role to play, with ‘deep swell’ bats now far more commonplace, enlarging the batsmen’s ‘sweet spot’ significantly thus extending a batsman’s room for error. So significant has this development been that the England & Wales Cricket Board (ECB) has acted, introducing ‘bat gauges’ – a bat-shaped measurer which, should a bat will not pass through seamlessly, can result in sanctions aimed at the offending players’ team. The first penalty of this type was enforced on Essex last year.

Though the International Cricket Council (ICC) stipulates that a cricket ground’s boundary must be no shorter than 65 yards (59.43 meters) from the centre of the pitch, some cricket grounds are comfortably larger than others.
This informs the run rate data, if we take the scoring rates of Hampshire and Somerset as examples. Hampshire’s home ground, the Utilita Bowl, has longer than usual boundaries, with it’s leg and off-side ropes reaching 82 meters.
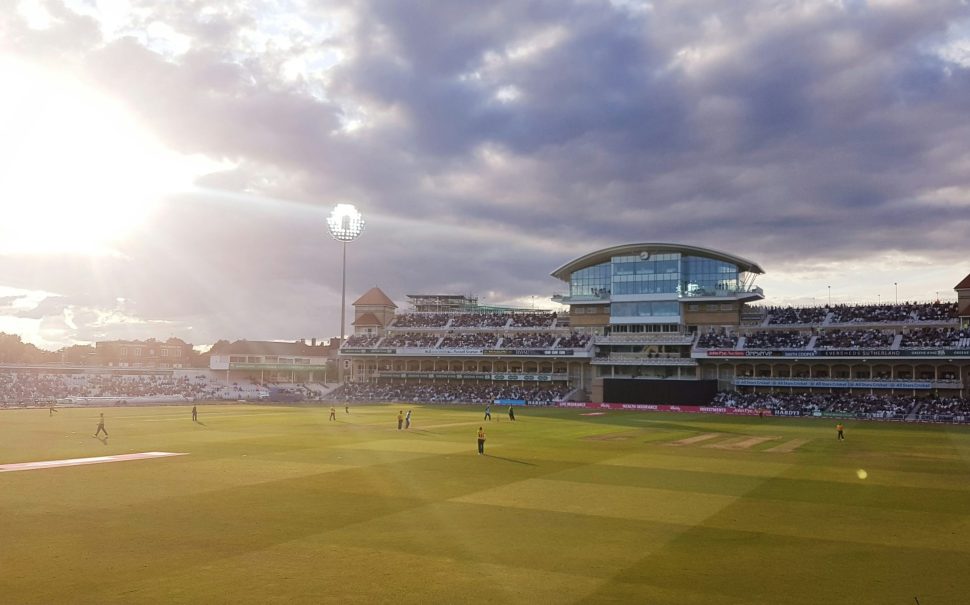
Compare that to Somerset’s home of Taunton, the atypical English cricket ground, and the shortest side is 64 metres. The numbers bear this out. Hampshire’s average run rate across all 22 editions of the t20 blast is 7.90, in comparison to Somerset’s 8.69. The further you need to go, fewer runs are scored over time.
Wisden’s Head of Content, Yas Rana, said: “Somerset, Notts & Essex have notoriously short boundaries. Surrey have a reputation for one of the best batting pitches in the country, certainly going back to 2003.”
“Durham, massive playing area – so do Hampshire. They have absolutely massive playing dimensions at the Utilita.”
Does A High Run-Rate Translate to Trophies?
Interestingly, long boundaries haven’t been to Hampshire or Leicestershire’s detriment, with each picking up three t20 trophies since 2003. No other side has won more, and this points to the somewhat surprising development that the two most successful sides are located in the bottom four of the run-rate table averages since 2003.
Rana said: “Bowling attacks and having bowling depth I think is probably as important as anything else in t20 cricket. If you have five really reliable bowling options, that’s probably a more sustainable way to winning lots of T20 games than having a batting unit that might over the course of the season having a really high average run rate, but that doesn’t mean you’re always getting 180.”
Run-rates play a significant role in the success or otherwise of cricket sides, but the data over time illustrates how factors beyond these have cause for consideration when seeking winning factors.
Whilst the run-rates of cricket teams are set to continue on their upward trajectory, this is and never has been a guarantee of trophies.