In a result few thought possible, Donald Trump has been elected as the 45th President of the United States.
Second favourite throughout an election campaign described as ‘dirty’ and ‘nasty’ by some, Trump was still seen as the outsider when the exit polls were released just an hour before the official results came through.
But the Republican did what he has done throughout his whole campaign and defied the odds to come out ahead of his Democratic counterpart Hillary Clinton.
Here is our detailed analysis into just how he managed to achieve this feat.
Proving the ‘experts’ wrong
When the exit polls were released shortly after voting was closed, Clinton looked almost certain to become the first female president.
On average, the data suggested that she was going to secure 46.8% of the popular vote, while Trump would come in with 43.6%.
Only 1/11 sources believed that Trump would come out on top, with more than half predicting Clinton would win by a margin of 4% or more, a significant figure in recent elections.
But this could not have been further from what was to unfold.
Capturing the ‘swing states’ early
Trump’s victory came down to the fact that he managed to secure a number of the key swing states early on in the process.
This included Florida, arguably the most vital, as well as Pennsylvania.
He also emerged victorious in Ohio, a state that has voted for the President in every election since 1960.
Here is a round-up of how some of the key statistics in the six states that swung from Democrat to Republican:
Florida (swing of 2.3%)
The state many saw as the most important as it carried 29 electoral votes, with only California and Texas having more.
Although it has traditionally been Republican in recent history, it voted for Obama (a Democrat) in the last two elections and had looked set to continue the trend by choosing Clinton
Iowa (swing of 15.3%)
Had the greatest vote swing seen in any of these states.
The five largest counties all voted for Clinton but 94 of the remaining 95 went in favour of Trump
Michigan (results not yet confirmed)
As things currently stand, Trump leads by 0.2% – the equal smallest margin of victory in a state alongside New Hampshire.
Had been heavily in favour of the Democrats since 1992
Ohio (swing of 11.6%)
The state has voted for the President in 81.5% of the elections they have participated in.
However, there are three other states who have a better success rate – New Mexico (88.9%), New York (84.2%) and Illinois (82%) – but all of them voted for Clinton this time round.
Pennsylvania (swing of 6.4%):
Trump emerged victorious here by 1.1%, the closest election in the state since 1840.
This was the first time its citizens have voted for a Republican since 1988
Wisconsin (swing of 7.8%):
Ronald Reagan was the last Republican voted for in this state, back in 1984.
Trump took this state with a margin of 0.9% but the closest result in its history came in 2000, when Al Gore recorded just 0.2% more of the vote than George Bush Jnr.
Securing surprising votes
While results suggest that a number of different societal factions made a significant contribution to his victory, there is one group that clinched the presidency for Trump: the white non-college educated.
A staggering 67% of voters categorised in this group voted for the Republican candidate, an increase of 14% from 2012.
This alone may not look that decisive but, in context, it was crucial.
A lot of these people live in the industrial Midwest, where a number of the key swing states are situated.
Many of these states, including Pennsylvania, have voted Democrat in recent years but have fallen on hard times recently and believe Trump is the more likely of the two to help them prosper again.
Furthermore, Trump also managed to cling onto the votes of those who he has offended.
One of the more surprising results was that he managed to secure 29% of the Hispanic/Latino votes.
This comes after he famously described the Mexican government as “totally corrupt” and said that America harbours “the killers, drugs and crime” from their neighbour.
Trump also threatened to build a wall to keep Mexicans out of the country but, despite this, managed to increase the number of votes from this section of the population from 8% in comparison to the 2012 election.
It wasn’t just Mexicans that Trump threatened to keep out of America either –
Muslims were on the receiving end of a similar threat.
In spite of this, 29% of those classified as having religious beliefs of ‘Something Else’ (anything outside Christianity, Catholicism, Judaism and Atheism), which includes Muslims, an increase of 18% from 2012. However, it has not been made public how many Muslims alone actually voted for Trump.
Despite the President-elect being accused of a number of sexual assaults in recent months, 42% of the female population also voted for Trump, as well as supposedly being recorded making derogatory comments about women.
It was thought that many women would turn their back on someone thought to be highly misogynistic, but the Democrats only experienced an increase of 1% among female voters.
Finally, 8% of black Americans also voted for Trump. While this may not look particularly high, this is an 800% increase from 2012 as only 1% voted for Mitt Romney.
It wasn’t a landslide win though…
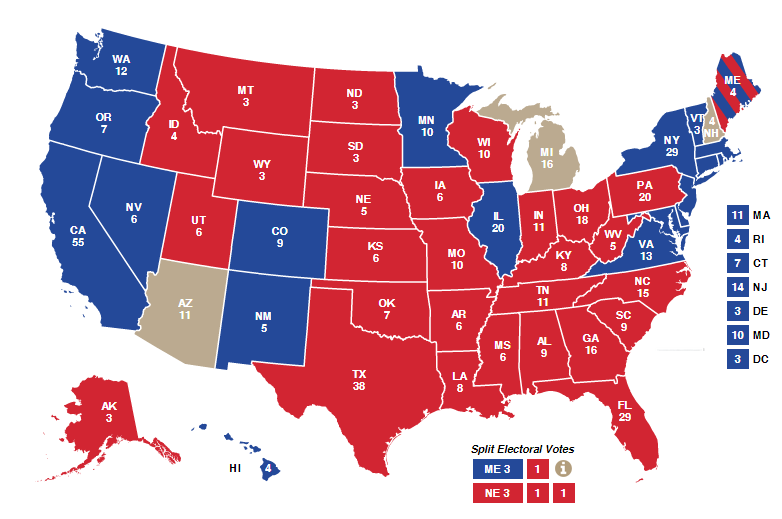
Although Trump’s defeat of Clinton may look pretty significant – he is predicted to take 306 of the electoral votes in comparison to the Republican’s 232 – this has been one of the closest elections in American history.
In fact, Clinton actually took more of the popular vote, only the fifth time a presidential candidate has done so without winning overall.
She secured 47.7% of the 129 million votes cast by the public, 0.2% more than Trump, also making it the third tightest contest in presidential history.
They key factor for Trump was that his votes came in states with a large number of electoral votes.
Clinton took California, which carries 55 votes, but Trump emerged victorious in the three states with the next highest proportion of votes – Texas (38), Florida (29) and Philadelphia (20).
Anything else?
One of the brilliant things about elections is that there are always loads of intriguing statistics, but only a select few are of any real interest to the majority. Here’s our round up just for you:
When Trump is inaugurated on 20 January 2017, he will be 70 years and 220 days old, making him the oldest ever president
With 232 electoral votes, Clinton will be the fourth most ‘successful’ loser of a presidential race, behind Al Gore (266 in 2000), John Kerry (251 in 2004) and Gerald Ford (240 in 1976)
The clearest margin of victory in any state came in the District of Columbia, with Clinton (92.8%) beating Trump (4.1%) by the huge margin of 88.7